
A profit and loss statement is a report that summarizes your revenue, costs, and expenses over a specific period to show whether the business made money or lost it. Reading one takes about 20 minutes if you work from the top down, subtracting one block of costs from another until you reach net income at the bottom.
Table of Contents
- What You Need
- Step-by-Step: How to Read a Profit and Loss Statement
- Start With the Reporting Period and Company Perspective
- Read Revenue and Sales From Top to Bottom
- Separate Cost of Goods Sold From Operating Expenses
- Calculate Gross Profit and Gross Margin
- Review Operating Expenses by Category
- Find Operating Income and Net Profit
- Compare the Statement With Earlier Periods
- Check Whether the Numbers Make Sense
- Use the Statement to Make Decisions
- Common Mistakes
- Mistakes to Avoid When Interpreting the Numbers
- Frequently Asked Questions
- Is a profit and loss statement the same as an income statement?
- Why does my P and L show a profit when I have no money in the bank?
- What is a good profit margin for a small business?
- Should I review my P and L monthly or only at tax time?
- Can I prepare my own profit and loss statement?
- When should I bring in an accountant to read my numbers?
- Conclusion: Start With the Bottom Line
What You Need
Gather four things before you start, and the reading goes smoothly. You need the statement itself, the reporting period it covers, the same statement from at least one earlier period, and a calculator.
- The statement, either a printed report or a screen from your accounting software. QuickBooks, Xero, Wave, and FreshBooks all generate one, and a spreadsheet built by hand works just as well.
- The reporting period. Check whether the report covers a month, a quarter, a year, or a year-to-date stretch. A year-to-date report is not comparable to a single month.
- A prior period. Pull the same month last year, or the previous month if your business is steady rather than seasonal.
- Your chart of accounts, the list of categories your bookkeeping software sorts every transaction into. This is what determines whether the report is useful or just accurate.
A badly organized chart of accounts produces a technically correct report that tells you nothing. Everything lumped into “Other Expenses” hides the number you actually needed to see.
Step-by-Step: How to Read a Profit and Loss Statement
Read the statement from top to bottom, then come back and compare. Each block ends in a subtotal, and every subtotal is a simple subtraction. The example below belongs to a vehicle wrap and signage shop for one month, and the same figures carry through the rest of this guide so you can check your own arithmetic against them.
| Line | Amount | How it is calculated |
|---|---|---|
| Gross sales | $52,400 | Everything invoiced before deductions |
| Less discounts, returns, refunds | -$4,800 | Money you gave back |
| Net revenue | $47,600 | 52,400 – 4,800 |
| Cost of goods sold | $18,260 | Materials and labor directly tied to delivery |
| Gross profit | $29,340 | 47,600 – 18,260 |
| Operating expenses | $20,190 | Rent, payroll, advertising, software, vehicle, insurance, depreciation |
| Operating income | $9,150 | 29,340 – 20,190 |
| Other expense (interest) | -$365 | Cost of borrowed money |
| Pre-tax income | $8,785 | 9,150 – 365 |
| Income taxes | $1,900 | Set aside for tax time |
| Net income (bottom line) | $6,885 | 8,785 – 1,900 |
Start With the Reporting Period and Company Perspective
The first line of a profit and loss statement tells you what period it covers and whose numbers these are. A statement produced for an LLC subsidiary is not the same as one for the parent company, and a consolidated statement rolls several locations or entities into a single column.
Also check whether it is prepared on an accrual basis or a cash basis. Accrual accounting records revenue when you earn it and expenses when you incur them, which is the standard for most US financial statements under GAAP. Cash basis accounting records money only when it moves. Ask which one you are holding before you compare it to anything else.
Read Revenue and Sales From Top to Bottom
Revenue, the top line, is the money your business earned during the period before any costs. On a simple statement that is a single number. A more detailed one breaks sales into product lines, service types, or locations, which is where you find the profitable slice.
Watch the deductions under gross sales. Discounts, returns, refunds, and allowances all reduce what you actually keep. In the example, $52,400 of invoiced sales became $47,600 of real revenue. A 9% gap between those two numbers is normal for a business that discounts, and reading the gross figure instead of the net one overstates your business by that same amount.
Separate Cost of Goods Sold From Operating Expenses
Cost of goods sold, or COGS, is the direct cost of delivering what you sold: materials, the labor that applies to production, and freight. Operating expenses are the costs of running the business regardless of what you sold that month, such as rent, salaried payroll, software, and insurance.
This is the pair small-business owners mix up most often, and mixing it up makes both margins meaningless. Shifting vehicle fuel from operating expenses into COGS makes your gross margin look worse and your operating margin look better, with no real change in profit.
Calculate Gross Profit and Gross Margin
Gross profit is net revenue minus cost of goods sold. In the example, $47,600 – $18,260 = $29,340, which is the amount left to cover every expense of running the business and still earn something.
Gross margin is gross profit divided by net revenue, expressed as a percentage: $29,340 / $47,600 = 61.6%. Compare that figure to last year and to similar businesses in your industry. A margin that is drifting down while revenue climbs usually means input costs are rising faster than your prices, and that is a pricing conversation, not a spending conversation.
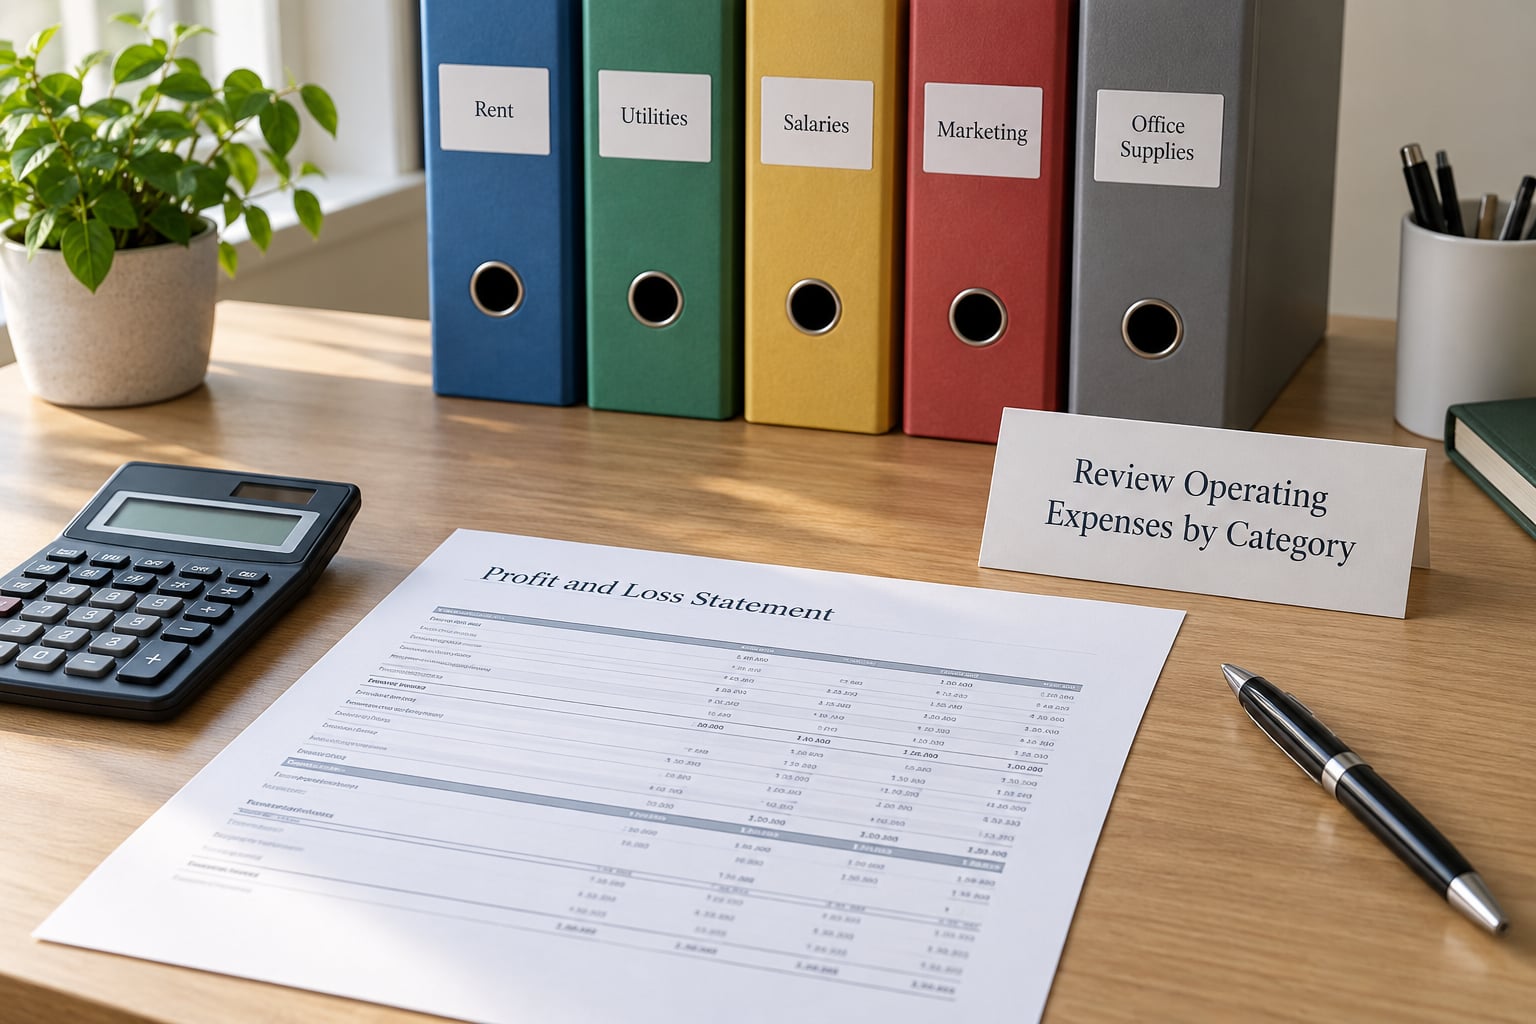
Review Operating Expenses by Category
Operating expenses are where most small businesses lose track of what is actually happening. Split them into fixed costs, which stay roughly the same every month, and variable costs, which move with volume.
- Fixed: rent of $3,600, salaried payroll of $9,850, insurance of $690.
- Variable: advertising of $2,450, vehicle costs of $1,320, software subscriptions of $780.
- Non-cash: depreciation of $1,500, the annual write-down of a machine or vehicle you paid for upfront. It reduces profit without reducing cash this month.
Add them up and you get the $20,190 above. Now compare each line to the same line last period, and hunt for anything that moved by more than the others. One line jumping while revenue stays flat is the finding worth your time.
Find Operating Income and Net Profit
Operating income is gross profit minus operating expenses, and it measures whether the core business makes money before financing and taxes. Operating margin is operating income divided by net revenue: $9,150 / $47,600 = 19.2%.
Net income, also called net profit or the bottom line, is what remains after interest, other income and expenses, and taxes. Here it is $6,885, or a 14.5% net margin. The gap between $9,150 and $6,885 is entirely below the operating line, so when the two disagree you look at interest and taxes, not at your day-to-day trading.
EBITDA, which lenders quote more often than net income, adds back depreciation and amortization: $9,150 + $1,500 = $10,650. It strips out financing and tax effects and non-cash write-downs, which is why two businesses with identical profits can show very different EBITDA.
Compare the Statement With Earlier Periods
Vertical analysis means dividing every line by revenue to see what share each one takes. Horizontal analysis means comparing the same line across periods. You need both, and most readers start with the second because it is faster.
Compare March to March, not March to July. In the example, the prior month showed net revenue of $44,900, a gross margin of 58.2%, operating expenses of $19,400, and net income of $5,120. Revenue grew about 6% while operating expenses grew 4%, so operating income climbed faster than sales, which is the direction you want.
Seasonality is where casual comparisons go wrong. A landscaping business in June and a retail business in December will look broken against the wrong month. Year over year is the honest comparison for seasonal work, and for steady businesses a rolling three-month average smooths out one-off months.
Check Whether the Numbers Make Sense
A profit and loss statement can be arithmetically perfect and still be wrong. Run these reasonableness checks before you act on it.
- Does net revenue match what your sales records, payment processor, and point-of-sale system report for the same period?
- Does COGS rise and fall with sales, or is it flat while revenue doubles? Flat COGS usually means inventory was expensed instead of costed.
- Is any expense category more than roughly 10% of revenue, and can you name the specific transaction that drove it?
- Are there one-time items buried in the totals, such as a legal settlement, a write-off, or a year’s rent paid in one month?
- Do owner draws appear as an expense? They do not. Draws are a distribution from the business to you, not a cost of doing business.
These same checks are what a lender or an investor runs first. Revenue that grows while receivables grow faster, expenses that rise much faster than sales, negative gross margin on a core product, and a business that books income but never shows cash are the patterns that make a reader stop and ask questions.
Use the Statement to Make Decisions
Turn the reading into action. If gross margin is falling while volume rises, test pricing or renegotiate material costs. If one expense category has doubled year over year without a matching revenue gain, find out what changed and when.
Segment the statement by product line or location to see which slice actually pays for the business. Then set aside tax as soon as net income appears, rather than in April, and build a cash reserve from the months that are strong.
Here is the reason owners get confused most often: a statement can show $6,885 of net income while the bank balance is nearly empty, and nothing is broken. Accrual accounting records a $9,000 invoice as revenue in the month you send it, even though the customer pays 60 days later. It records a $6,000 equipment purchase as $1,500 of depreciation, not as a $6,000 cash outflow. Owner draws take cash out without ever appearing as an expense.
That is also why your tax return is not a P&L. The tax return may use a different method, different depreciation schedules, and different expense categories, and the two documents will rarely agree line for line. Use the P&L to run the business and the tax return to file taxes.
Build a 15-minute monthly routine: check the reporting period, read the four big numbers, note anything that moved more than 10%, and mark one question to answer before next month. Fifteen minutes on the same day each month teaches you more than a long review at tax time.
Common Mistakes
Most misreadings come from treating the statement as a bank record rather than a management report. The corrections are simple once you know them.
Mistakes to Avoid When Interpreting the Numbers
- Treating net income as cash. Profit and cash move on different schedules. Check the bank balance and the cash flow statement before assuming you can spend the bottom line.
- Reading one unusual month as a trend. A single large equipment purchase or a seasonal spike will mislead you. Look at three months or compare the same month year over year.
- Comparing different periods. A quarter next to a month, or a year-to-date report next to a full prior year, produces meaningless percentages.
- Mixing personal and business spending. Personal charges coded to expense accounts shrink your profit without any real cost to the business. Reclassify them as owner draws.
- Splitting costs into the wrong block. Moving expenses between COGS and operating expenses changes both margins while leaving net income untouched. Fix the classification once and leave it.
- Assuming the statement is complete. A P&L covers one period. It says nothing about what you owe, what you own, or whether the numbers were reconciled to the bank.
Two related documents answer the gaps. The balance sheet shows what the business owns and owes at a single moment. The cash flow statement shows actual money moving in and out. The P&L answers one question only: did the business earn a profit during this period?
| Report | What it measures | Time view | Question it answers |
|---|---|---|---|
| Profit and loss statement | Revenue, costs, and expenses | A period of time | Did we make money? |
| Balance sheet | Assets, liabilities, and equity | A single moment | What do we own and owe? |
| Cash flow statement | Money moving in and out | A period of time | Where did the cash go? |
If you want to check your understanding before going further, the calculation ladder is the whole statement in five moves. Revenue minus cost of goods sold equals gross profit. Gross profit minus operating expenses equals operating income. Operating income plus other income minus other expenses equals pre-tax income. Pre-tax income minus taxes equals net income. If your statement does not follow that ladder, the report is laid out unusually or built from a messy chart of accounts.
Frequently Asked Questions
Is a profit and loss statement the same as an income statement?
Yes. Income statement, profit and loss statement, P and L, earnings statement, operating statement, and statement of operations all name the same report. The P and L covers a period of time and shows revenue, costs, and expenses ending in profit or loss, while a balance sheet shows assets and liabilities at one moment.
Why does my P and L show a profit when I have no money in the bank?
Profit and cash are recorded on different schedules. Accrual accounting counts a sale when you invoice it, not when the customer pays, and spreads a large equipment purchase across its useful life as depreciation. Unpaid invoices and owner draws absorb the cash that the profit suggests is available.
What is a good profit margin for a small business?
It depends on your industry, not on a universal number. Restaurants commonly run 4% to 6% net margins, and professional services often run 15% to 25%. Compare your figure against businesses like yours and against your own past year, since a margin that holds steady while revenue grows is the real goal.
Should I review my P and L monthly or only at tax time?
Monthly. A 15-minute review at the same point in each month catches a pricing problem or an expense spike while it is still small, and gives you a year of signals instead of one. Waiting until tax time means you are reading a document about a period that has already closed and cannot be changed.
Can I prepare my own profit and loss statement?
Yes, if you keep clean records. A spreadsheet can total income and expenses by category over a period, and bookkeeping software can do it faster. Many owners build their own first draft and have an accountant review it quarterly, which costs less than having a full set prepared from scratch.
When should I bring in an accountant to read my numbers?
Bring one in when the report does not reconcile to your bank balance, when expenses are split between categories and you cannot tell why, when revenue is growing but profit is falling, or when you are preparing for a loan, an investor, or a sale. Those are decisions where a small professional fee is cheaper than a wrong one.
Conclusion: Start With the Bottom Line
Reading a profit and loss statement well comes down to four numbers compared across periods: revenue, gross margin, operating expenses, and net income. Work out which one moved the most, then go find the specific transaction that moved it before you change a price, cut a cost, or hire anyone. Fifteen minutes a month, same day every month, is enough to catch nearly everything that matters.